Three cell models and five tested stressors in a sponsored laboratory study.
The pictures catch your eye: cells, a bright green signal, and a comparison with Protandim. Before we decide what those pictures mean for our lives, let’s look at what happened in the lab.
The report supplied by LifeVantage identifies the company as the study sponsor. It describes an in vitro experiment: researchers treated cells in laboratory culture. People did not take part in this particular experiment. [1]
What did they test?
The cell models were HepG2, dermal fibroblasts, and Caco-2, used to model aspects of liver, skin/connective tissue, and the intestinal lining. The stressors were polystyrene nanoparticles, atmospheric particulate matter, the phthalate DEHP, pure glyphosate, and methylglyoxal. [1]
These are specific laboratory materials at selected concentrations. Methylglyoxal was used to represent diet-related stress; the researchers did not feed cells an actual ultra-processed meal. A laboratory concentration also does not tell us the dose someone receives from a water bottle or a fragrance.
The green is a signal
The report describes a fluorescent assay for reactive oxygen species, or ROS. It uses green fluorescence as an indicator of oxidative stress. Its comparison images show cells without a stressor, cells with a stressor, and stressed cells treated with Protandim Nrf2 Synergizer. The report describes a lower fluorescence signal after treatment. [1]
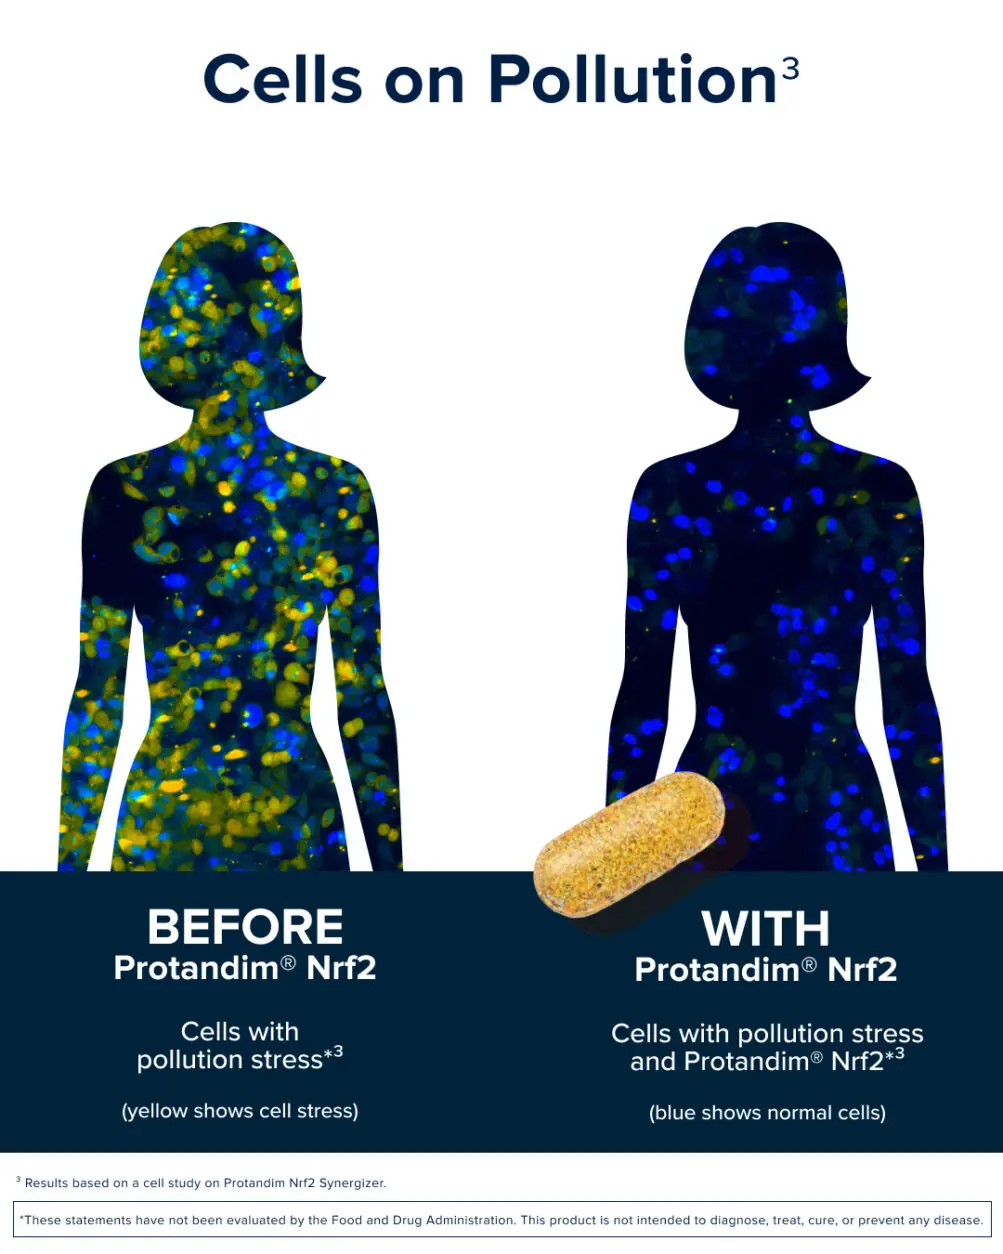
The green does not show the toxins themselves. Less green does not demonstrate that microplastics, pesticides, or other substances were removed from a person’s body.
How to read the reported percentages
Table 5 lists changes greater than 100%, but the report does not provide a clear calculation formula for interpreting those values as ordinary percentage reductions. The calculation needs clarification before these values can be interpreted as standard percentage reductions.
The report also does not provide a journal citation or DOI for this new experiment. It includes references to other published research, which should be evaluated separately. A sponsor’s write-up and a peer-reviewed clinical trial serve different purposes.
Sources & context
- LifeVantage Corporation · Modern Stressors study report, supplied 2026 ↗Methods and cell models: PDF pages 2–4. Images: pages 4–9. Quantified ROS table and discussion: page 10. Company-sponsored laboratory report.
Angel Fletcher is an independent LifeVantage consultant and may earn from purchases through her links. These articles are general education, not medical advice or a diagnosis. Sources are linked for readers to examine; citing a source does not imply its authors endorse LifeVantage. No article or quiz establishes that you need a supplement.